Devon Meier · 13 October 2026
Astronomers Use Machine Learning to Map Long-Term Changes in Orbital Debris Distribution
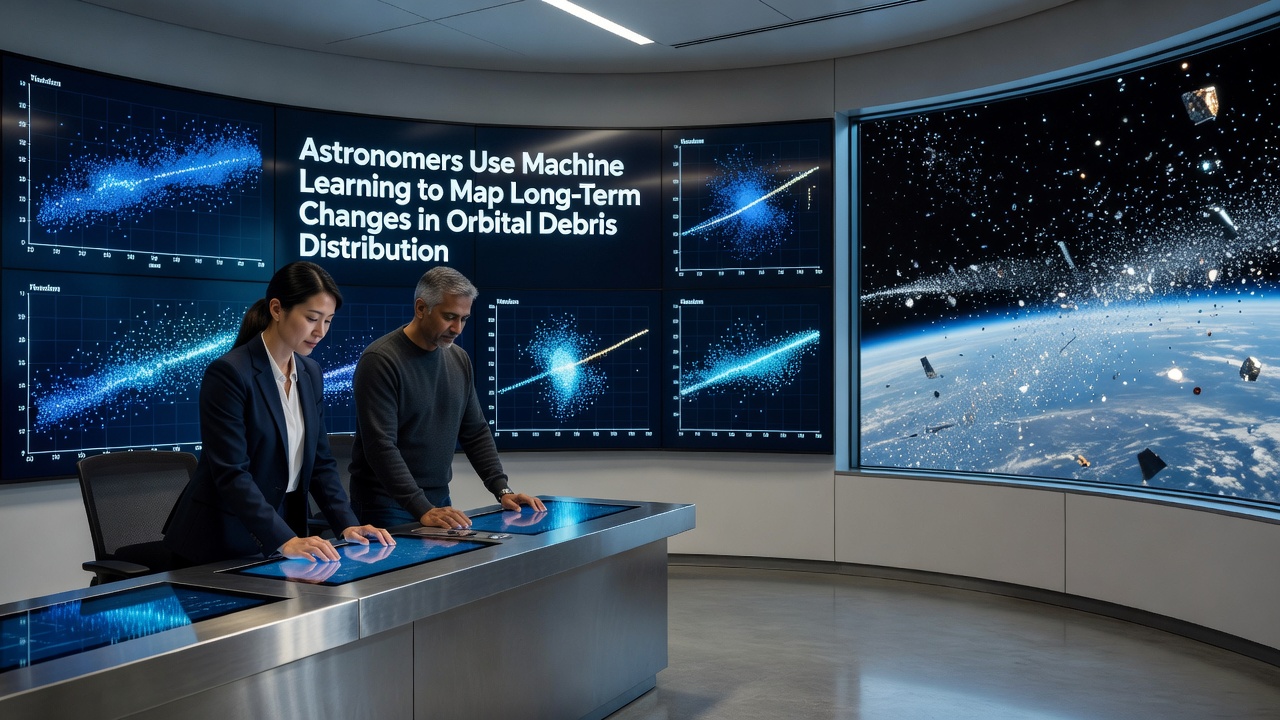
Space agencies and research teams have turned to machine learning techniques to track how orbital debris has shifted over decades, and this approach processes vast datasets from ground-based telescopes along with satellite sensors to reveal distribution trends at various altitudes. Researchers at institutions across North America and Europe compiled historical observations dating back to the 1990s and applied neural networks that identify clusters of fragments in low Earth orbit while distinguishing them from active satellites.
Tracking Debris Through Advanced Algorithms
Ground observatories in Australia and Canada supply continuous streams of positional data that feed into these models, and the algorithms detect subtle changes in density that occur because of atmospheric drag, solar activity cycles, and occasional collisions. One study released in October 2026 showed how debris populations above 800 kilometers have migrated into denser bands over twenty years, a pattern that traditional statistical methods had missed due to the volume and complexity of the inputs.
Teams integrate radar returns from multiple sites to build training sets, then let convolutional networks classify object types based on radar cross-section signatures and velocity vectors. This method improves accuracy when predicting future positions because it accounts for perturbations from Earth's oblateness and third-body gravitational influences at the same time.
Key Data Sources and Geographic Contributions
Observations collected by the NASA Orbital Debris Program Office form one core dataset, while complementary measurements from the European Space Agency's Space Debris Office add coverage of higher inclination orbits. Analysts combine these records with optical surveys from Chilean and South African facilities to create global maps that span both equatorial and polar regions.
Machine learning pipelines normalize the different sensor resolutions and temporal sampling rates before running anomaly detection routines, and the output highlights long-term migration of fragments from sun-synchronous orbits toward lower altitudes where reentry becomes more probable within a century.
Findings on Altitude-Specific Changes
Models trained on twenty-five years of records indicate that the 600-to-900-kilometer shell now contains higher concentrations of small debris than earlier projections suggested, whereas the 400-to-600-kilometer band shows faster clearance rates linked to increased solar maximum activity in recent cycles. These shifts matter because many operational constellations occupy the lower band while older rocket bodies and defunct payloads linger higher up.
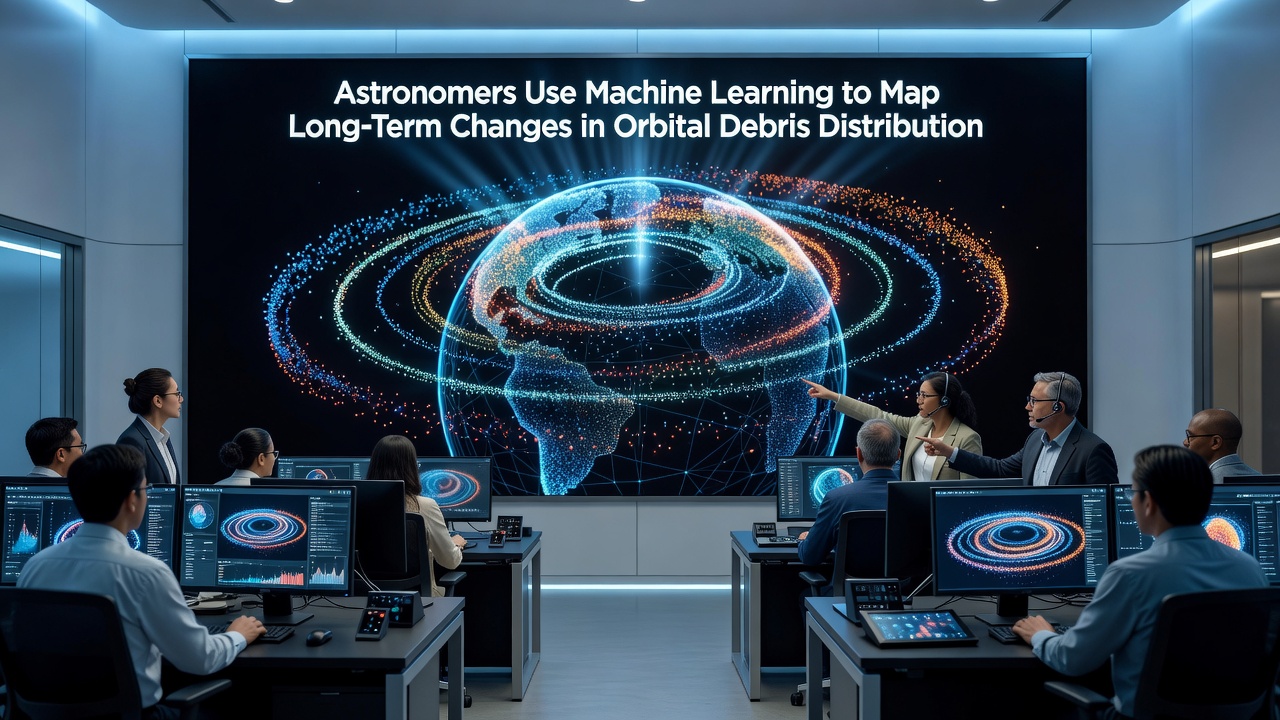
Researchers cross-validated the neural network outputs against independent laser ranging measurements taken at Australian facilities, confirming that fragmentation events from 2015 and 2019 produced debris clouds whose orbital evolution matched the predicted dispersion patterns within a few percent. The same frameworks also flag potential future collision risks by simulating thousands of object trajectories simultaneously.
Integration With Existing Monitoring Systems
Space situational awareness centers now incorporate these machine learning outputs into daily conjunction assessment reports, and operators receive refined probability estimates that reflect long-term density evolution rather than static snapshots. Canadian and Japanese agencies have begun testing hybrid systems that blend classical orbital propagators with learned correction terms derived from the debris mapping work.
Additional training data comes from in-situ measurements returned by CubeSats equipped with impact detectors, which supply ground-truth counts of particles too small for ground radar to resolve. When these counts feed back into the models, the networks adjust their estimates of the unseen population at sub-centimeter sizes across multiple orbital shells.
Conclusion
Continued application of machine learning to archival and real-time debris observations provides clearer pictures of how distributions evolve, and agencies plan to expand the geographic reach of input data while refining model architectures for higher temporal resolution. The resulting maps support more informed decisions on end-of-life disposal strategies and protected orbital zones without relying solely on short-term statistical extrapolations.